The Global Fund is committed to being transparent about the data that we use, the methodologies we adopt, the results we report, and the impact that our partnership achieves. The Global Fund is also eager to show the reasoning behind the approaches we take and any limitations we identify. The 2024 Aid Transparency Index acknowledged the Global Fund’s rigorous systems and commitment to transparency and gave the Global Fund a rating of “Good.”
Notes on Programmatic Results
A Partnership Approach to Results Reporting
This approach to reporting the results and impact of the Global Fund has been developed by the partnership itself, under the leadership of the Board, technical partners and other stakeholders.
The core objective of the Global Fund is to end AIDS, tuberculosis (TB) and malaria by 2030 in the countries where we invest. In developing the Global Fund Strategy 2017-2022 [ download in English | Français ] , we conducted extensive consultations in 2015 and 2016 across the partnership on how to best report results and measure the impact of Global Fund investments in national programs. The consensus was that full national results were the best way of measuring progress against the targets set out in the Global Fund Strategy 2017-2022 and toward the ultimate goal of ending the three diseases by 2030. National results should therefore be the starting point for any assessment of the Global Fund’s performance. This approach has been maintained in the Global Fund Strategy 2023-2028 [ download in عربي | English | Español | Français | Português | Русский ] . The Global Fund’s objective is to ensure the success of the country-led national programs that we support alongside other bilateral and multilateral funders, and to complement countries’ own domestic contributions.
For the reasons above, the Global Fund reports the full national results of the countries where we invest, rather than reporting solely on the specific projects we fund. This reflects a core principle of the Global Fund: We support national health programs and strategies to achieve national goals. By reporting full national results, the Global Fund can show the impact of the programs we support together with all international and national partners. These results demonstrate where countries are on track to achieve the 2030 targets of ending the three diseases. With this approach, we avoid the pitfall of celebrating the achievements of specific programs supported by the Global Fund when a country as a whole is making insufficient progress or sliding backwards. Furthermore, reporting national results prevents misleading efforts to attribute shares of impact to different actors. Most of the programs and interventions the Global Fund supports involve a mix of domestic resourcing and Global Fund investments, and many involve other external donors. Attributing results to different partners in a common program leads to arbitrary assumptions and ignores the inherently interconnected nature of public health interventions.
An example of this would be a national HIV treatment program where the Global Fund procures the antiretroviral medicines and supports community outreach, PEPFAR funds clinical delivery and laboratory testing, and the government funds the supply chain and underlying infrastructure. In this case, the contribution of each partner is essential for the program to function. Examining scenarios that modify the contribution of a single funder while holding others fixed would likely be misleading or require arbitrary assumptions. Consistent with the collaborative approach in which these programs are funded, the Global Fund believes that where governments, bilateral partners, technical partners and the Global Fund all contribute to the same program, they ought to cite the same results.
Reporting on national results keeps the focus on the big picture and ensures the Global Fund’s interventions are designed to maximize our contribution to achieving each country’s overall goals for the three diseases.
To complement reporting on full national results, the Global Fund provides more granular results profiles for high-impact countries – those with the greatest disease burden – which include key financial and programmatic information along the results chain. These profiles are produced for each disease and resilient and sustainable systems for health separately, are updated annually and are available on the Data Explorer.
The Global Fund also makes available information on the progress of individual grants in an open data format, accessible via the Global Fund’s Data Service. Data from our portfolio are available through our application programming interface (API), where data sets and reports are available for download. The API is available on the Data Service.
Performance of Global Fund Investments
While the Global Fund focuses our results reporting on national results, we also monitor and report on the performance of specific programs and interventions funded by Global Fund grants. This ensures we are delivering value for money and monitoring the performance of our investments. The Global Fund’s Key Performance Indicators Handbook [ download in English ] for the 2023-2028 Strategy encompasses the reporting of specific key performance indicators (KPIs) to our Board on a range of metrics covering areas attributable to the performance of Global Fund investments, such as the performance of individual programs against agreed grant milestones and targets, absorption rates, fulfilment of co-financing commitments, supply chain metrics, performance of equity/gender/human rights indicators, support in delivering people-centered, high-quality services, progress in pandemic preparedness, and health products market-shaping initiatives.
The Global Fund also provides additional financial and programmatic information through a Data Explorer platform, which includes data and information on resource mobilization, access to funding, financial insights and annual results as well grants performance to complement our regular reporting on national results and overall KPIs; this enables stakeholders to see how Global Fund investments work alongside the investments of governments and other partners in high-impact countries.
Investing in Better Data in Countries
The Global Fund is one of the largest investors in national health information systems in low- and middle-income countries. The Global Fund has invested more than US$150 million annually over the past grant cycles in strengthening digital health and information systems in countries to improve data availability, quality and agility, thus improving how health data and intelligence is interpreted and acted upon. Key Global Fund priorities for supporting national health information systems are:
- Supporting investments to strengthen routine health information systems (RHIS) to produce timely and quality data.
- Supporting national and sub-national capacity for data analysis, interpretation, and use.
- Strengthening the foundations and governance of interoperable national data systems.
- Optimizing more advanced levels of digitization according to country context and readiness.
- Continuously supporting system integration across disease programs, community and private sector health data reporting.
- Supporting priority population-based surveys.
Moreover, the Global Fund has been supporting national health programs in more than 80 countries to apply disease transmission models and costing tools to inform the development of national strategic plans and funding requests, strategically allocating resources across interventions, geographies, and population groups in order to maximize impact. Since the COVID-19 pandemic, the Global Fund has been systematically investing in early warning surveillance to improve the detection and management of epidemic-prone diseases and events, through C19RM funding and grants for HIV, TB and malaria and resilient and sustainable systems for health.
Notes on the Methods to Estimate Lives Saved by Global Fund-supported HIV, TB and Malaria Programs
The methods for reporting on lives saved by Global Fund-supported programs are the same methods currently used by our technical partners (see the details below) and follow the recommendations of an expert group that met in July 2014 to address methodological issues around estimating lives saved. The group included leading experts, technical partners and other global health organizations, including PEPFAR, WHO, UNAIDS, the RBM Partnership to End Malaria and the Stop TB Partnership. The expert group made several recommendations to enhance the Global Fund’s approach to calculating the number of lives saved, and published a detailed meeting report, the Expert Panel on Health Impact of Global Fund Investments Geneva [ download in English ] . Furthermore, the Strategic Review 2015 [ download in English ] commissioned by the independent Technical Evaluation and Reference Group (TERG) and then reviewed and endorsed by the Global Fund Board’s Strategy Committee, concluded that the model used by the Global Fund to assess impact was satisfactory.
To provide ongoing support and guidance, the Global Fund has also established a modeling guidance group consisting of technical partners, including WHO and UNAIDS, modeling experts from leading academic institutions, and other partners. This expert group provides ongoing advice and technical support on the disease transmission models used by the Global Fund, details methodological issues around measurement of impact and efficiency of Global Fund-supported programs, and addresses the limitations of current approaches.
Data Sources
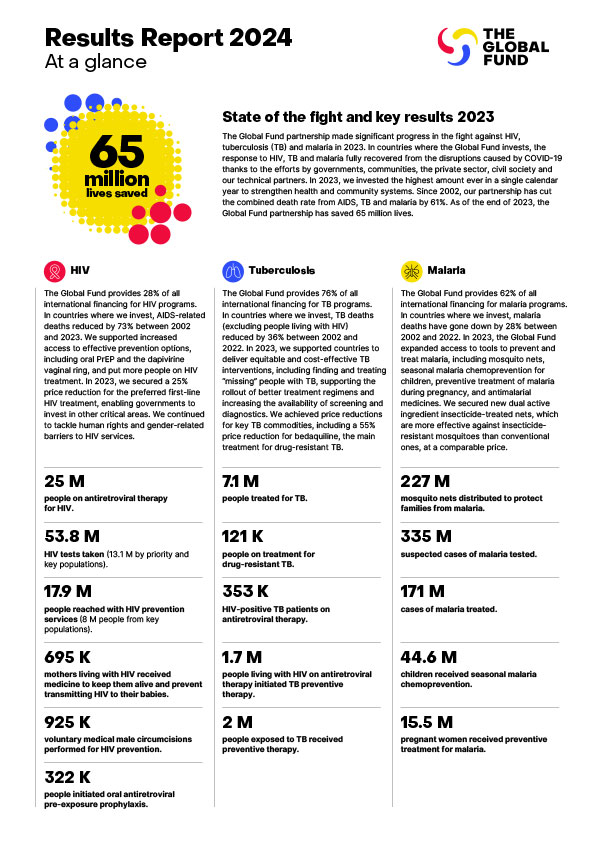
Every year, WHO and UNAIDS publish updated estimates of the burden of HIV, TB and malaria and generate an estimate of lives saved through interventions provided by the national health programs for the three diseases. The figure of lives saved in the Global Fund Results Report 2024 corresponds to the portfolio of countries where the Global Fund has been investing since our inception using the latest WHO estimates of lives saved by TB and malaria interventions and the latest UNAIDS and Avenir Health estimates for lives saved by HIV interventions. The calculations are described below.
Computation Method
The number of lives saved in a given country and year is estimated by subtracting the number of deaths that occurred from the number of deaths that would have occurred in a counterfactual hypothetical scenario where key disease interventions did not take place, as follows:
In the period defined by  , the lives saved is estimated as:
where  represents disease-specific deaths averted and
  represents the different diseases, consisting of:
- HIV.
- TB among HIV-negative persons.[1]
- Malaria.
For the report published in September 2024,  represents the full calendar years of 2005-2023 inclusive.
In each case, for each disease, deaths averted are calculated as the difference in deaths occurring over period  under two scenarios, computed as:
Where: is a model for disease
  in country
  , that represents the observed course of the epidemic;
  represents the same model estimated under a counterfactual scenario, representing the absence of effort to combat the disease (the derivations of these models for each disease are described below).
  is the number of deaths in year
  in a particular model;
  is the set of countries in the Global Fund portfolio for disease
  .
.
 is the fraction of the national-level impact for that disease in that country in that year that is included in Global Fund reporting. Until the end of 2016, the Global Fund only included the total national number of lives saved for a given supported country where a set of criteria in relation to the reported programmatic results were met. The criteria included meeting a minimum threshold of the Global Fund disbursement to the specific programs, either in absolute number or as a percentage of reported public expenditure. From 2017, and following consultation with the Board and key partners, a fully contributory approach is applied, in which the total number of lives saved is counted for a given year and in a given country where the Global Fund invests. Thus,
  is an indicator function for whether a country’s results are included in a particular year; and
 ![]() .
.
Disease-specific Models
A brief overview of models used by the technical partners to estimate lives saved is provided below.
HIV
Details on Spectrum AIM and GOALS models can be found here.
 : This model is exactly equal to the respective estimates published by the UNAIDS using AIM model.
 : This model is identical to
  with the following exceptions:
In the period prior to 2017:
- The model used is the AIM model.
- The coverage of antiretroviral therapy (ART) is assumed to be zero in every year.
In the period since 2017:
- The model used is the GOALS model, unless the country did not have a GOALS model, in which case its AIM model is used instead.
- The coverage of ART and all other programs is assumed to be zero in the year 2017 and thereafter.
- The parameter values relating to “risk behaviors” in the year 2015 are used for every year thereafter.
Tuberculosis
To estimate the number of deaths averted by TB interventions, the actual number of TB deaths is compared with the number of TB deaths that would have occurred in the absence of TB treatment (and without ART provided alongside TB treatment for HIV-positive cases). The latter figure can be estimated conservatively as the number of estimated incident cases multiplied by the relevant estimated case fatality rate (CFR) for untreated TB. CFRs restricted to HIV-negative TB deaths and cases are applied here to avoid double counting with deaths averted from HIV-positive TB patients. The estimate of the number of deaths averted is conservative, because it does not account for the impact of TB services or availability of ART on the level of TB incidence; it also does not account for the indirect, downstream impact of these interventions on future levels of infections, cases and deaths (details on WHO methods for estimation of burden and deaths averted can be found here).
 : This model is exactly equal to the respective estimates published by the WHO Global Tuberculosis Programme to estimate the global burden of TB disease and lives saved.
 : This model is identical to
  with the following exception:
- The CFR for all cases is equal to that for untreated cases (i.e., representing there being no treatment) with no impact transmission or other disease dynamics.
 is only defined in respect of the number of deaths, which is derived thus:
where  is the case-fatality rate for untreated cases. (Note that this value is the same for all countries and over time.)
Malaria
Applying WHO methods, deaths averted are calculated by comparing the current annual estimated burden of malaria with the per capita at risk malaria mortality rates in the year 2000.
 : This model is exactly equal to the respective estimates published by the WHO Global Malaria Programme.
 : This model represents the epidemic at the extent estimated to have occurred in the year 2000, which is expressed as maintaining per-capita risk of malaria deaths in the year 2000 over the following years.
 is derived thus:
Where  is the ratio of the population at risk in year
  to that in the year 2000. Thus:
Where  is the number of people who are living in malaria risk areas, which is estimated by WHO.
Method to Estimate Indirect Benefits of Actions to Eliminate HIV Through Reduced Utilization of Primary Health Care
Providing effective care for HIV, TB or malaria can reduce the need for primary health care, by preventing individuals with one of these conditions from becoming ill and seeking care, and by preventing disease transmission that would lead to ill health and treatment-seeking in the future. To estimate how investments in HIV have reduced the need for primary care, we compared two scenarios – one scenario representing the actual scale-up of care for each of the three diseases, and a hypothetical counterfactual scenario in which care for each disease was limited to services levels in the year 2000 (representing what might have happened with no additional investments from government, Global Fund and other sources over the following decades). Using a specific model, we estimated the consequences of these two scenarios for each country ever receiving any Global Fund support, with results simulated for the period 2000-2023, but counted since 2002 when the Global Fund was founded for the purpose of this report. From this modeling we estimated the difference in the number of person-years spent with untreated symptomatic disease between scenarios. We used the HIV-specific model to calculate the number of individuals with HIV not on antiretroviral therapy (ART) stratified by CD4 cell count, for each country, year and scenario. We subtracted results from the actual scenario from the counterfactual scenario to estimate the additional number of people with untreated disease without HIV investments. We multiplied these values by the additional health care utilization for individuals with untreated HIV (by CD4 cell count category) as compared to HIV-negative individuals, based on published data and IHME estimates of country-specific utilization trends. From this analysis we estimated incremental differences in outpatient utilization (number of clinic visits), and inpatient utilization (number of hospital bed days). To estimate the cost-savings associated with this reduction in utilization, we multiplied the number of each of these services by its country-specific unit cost, which were based on WHO CHOICE estimates. Total reductions in utilization and cost savings were calculated by summing results over all countries and years. The Global Fund commissioned an associate professor from the Harvard T.H. Chan School of Public Health to conduct this study. A similar study for TB and malaria is underway.
Method to Estimate the Benefits of Increasing Oxygen Access to Reduce the Burden of Disease from TB, HIV, Malaria and Conditions Not Related to the Three Diseases
A modeling analysis was conducted to estimate the potential impact of the Global Fund investments in oxygen pressure swing adsorption plants, oxygen concentrators and cylinders and related oxygen system items including pulse oximeters made in 14 priority countries (Burkina Faso, Cameroon, Ethiopia, Ghana, Guinea, Indonesia, Liberia, Malawi, Mozambique, Nigeria, Sierra Leone, Tanzania, Zambia, and Zimbabwe) over the 2024-2026 period. The potential impact of these investments was estimated among those people suffering from lower respiratory infections, malaria, TB, HIV and AIDS, chronic obstructive pulmonary disease (COPD), asthma, cardiovascular disease and maternal and neonatal disorders. The analysis was conducted using a deterministic model using input data (2019-2021) from the IHME Global Burden of Disease[2] by condition, age group and country to project oxygen demand over the 2023-2026 period. The model estimates existing coverage (scenario 1), Global Fund-added coverage for 2023 and 2026 (scenario 2) and the gap to cover 70% and 100% of the estimated oxygen need (the former accounting for lack of effective coverage due to quality of care issues). The gap is estimated in oxygen liters needed and costs. The health impact of these investments is estimated in terms of number of disability-adjusted life years (DALYs) and deaths averted. By estimating and monetizing the gap between the current oxygen coverage and the potential coverage that Global Fund investments would achieve, the study estimates the return on investment using cost-effectiveness thresholds for each country, and the value of that investment. The Global Fund commissioned a professor of Global Health Systems, Epidemiology and Evaluation at the University College London Institute for Global Health to conduct this study.
Method to Estimate the Benefits of Investing in Human Resources for Health to Reduce the Burden of HIV, TB and Malaria As Well As Conditions Not Related to the Three Diseases
A modeling analysis was conducted using the Thanzi La Onse (TLO) Model[3] to estimate the health impact of recent investments on human resources for health (HRH) in Malawi. The TLO model is an individual-based simulation that evaluates the interaction of individuals with the health system through a series of disease modules that include malaria, HIV, TB, measles, acute lower respiratory infections, diarrhea, diabetes, hypertension, heart disease, epilepsy, depression, road injuries, cancers, stroke, kidney disease and schistosomiasis. The demand for HRH through those disease modules is estimated and the model determines the potential effects of the increase in HRH, and subsequently, on averting DALYs and deaths.
The TLO model is calibrated to epidemiological and health system data in the period 2015-2019. From this, the model “learns” the effective productivity per health care worker (of each cadre, facility level and district). In the “counterfactual” scenario, the overall capacity of the workforce is held constant; in the “actual” scenario, the overall capacity of the workforce is scaled up in line with the increase in the number of health care workers.
“Constraints” are applied in the model to reveal the beneficial impact of the additional capability. This means that health care services are only provided where there is the time available of the relevant cadre(s). If a service cannot be provided immediately, it may be delayed or not provided at all. Therefore, more health care workers imply greater productivity of the workforce, and a greater chance that health care can be provided in a timely manner. The consequences of this on health outcomes are captured in the model.
The projected impact of increased access cover two time horizons: 1) 2021-2023 (retrospective); and 2) 2024-2030 (prospective).
It is worth noting that the projected impact could be under-estimates of total impact, due to cautious assumptions made:
- Considers only national constant scale-up for all cadres (does not consider variances by district, cadre or year that could have directed scale-up to most needed positions).
- Does not reflect changes in patient/health care worker behavior that may result from increased availability of staff (higher propensity to seek care or longer times for appointments that may lead to higher quality).
Other limitations may mean this is an over-estimate:
- Assumes that health gains could not have been achieved by increased productivity of existing staff.
- Assumes productivity of new staff is the same as existing staff, but time for on-boarding etc., may mean this is not the case.
To conduct this study, the Global Fund commissioned a modeling team led by a professor of global health at Imperial College London with close collaboration with the Kamuzu University of Health Sciences in Malawi and the Malawi Ministry of Health.
Method to Estimate Return on Investment (ROI)
The ROI of the Global Fund’s historical investment in HIV and AIDS, TB and malaria was estimated for each country and disease via two methods: “intrinsic” and “instrumental” valuation of the averted burden of the three diseases. Estimates of the “intrinsic” value of health are based on what individuals are willing to pay for improvements in their own health, whereas the “instrumental” valuation considers the extent to which reductions in sickness and premature deaths increase productive work.
The actual burden of the three diseases over the past two decades was compared to a counterfactual scenario in which the coverage of key interventions of each disease were assumed to be maintained at 2000 levels. For the actual and counterfactual scenarios, a modeling exercise was conducted to estimate the annual number of cases, deaths, DALYs and cost. The cost of the actual scenario compared to the counterfactual scenario is a net cost that includes both the cost of the interventions, i.e., those that prevent cases of disease or improve treatment, as well as health sector cost savings from not having to treat as many cases. For both valuations, and following standard approaches,[4],[5] the present value of the projected stream of future costs and benefits was calculated by applying a discount rate of 3% per year. As Global Fund investment in countries varies as a proportion of the total cost, a Global Fund-specific ROI ratio was derived by weighting the disease-specific costs and benefits according to the countries’ share of Global Fund allocations during the assessment of 2000-2022 for which modeling results and key input data were available. The estimated ROI then was applied to the total Global Fund disbursement from our inception up to end 2023.
Section I: Intrinsic Valuation
Following the methodology of recent Benefit Cost Analysis (BCA) guidelines[4],[5] an adjusted Value of a Statistical Life-year (VSLY) calculation was used to calculate country- and year-specific VSLYs that anticipate economic growth in Global Fund supported countries:
where VSLYit is calculated using the 2019 estimate of the Value of a Statistical Life (VSL) for the United States of US$10.9 million[6], and transferring it to Global Fund-supported countries based on the difference in income between the United States (GDPUSA ) and the country (GDPit ), where GDPit is purchasing power parity (PPP)-adjusted gross domestic product (GDP) per capita of country i in year t in international dollars, which was obtained from the April 2024 World Economic Outlook[7]; GDPUSA is the PPP-adjusted GDP per capita of the United States (estimated at US$77,192 for 2022); e is a conservative estimate of income elasticity of 1.5, reflecting that poorer individuals are willing to pay a lower portion of their income for a given incremental of health risk reduction, compared to higher-income individuals; and PV <0.5*LEBi> is the discounted remaining life expectancy from middle age. As a proxy (recommended in BCA guidelines),[8] we used one-half of life expectancy at birth of country i in the year 2000 obtained from the World Bank[9]. We deviated from the BCA guidelines by discounting the remaining life expectancy when converting VSL to VSLY, but this was necessary in order to be consistent in discounting all health benefits and costs, accounting for the year in which they occur. To calculate the ROI, the total number of discounted DALYs averted in each country and year as predicted by the modeling was multiplied by the country/year-specific VSLYs. In this way, we made a choice to value deaths proportionally to the remaining life expectancy associated with the counterfactual of that death (how long they would live if they had not died), and we are also valuing the reductions in non-fatal morbidity associated with these diseases.
Section II: Instrumental Valuation
When cases are prevented or effectively treated, household members can continue or return to productive work. Following a standard human capital approach for calculating “indirect cost” in cost-of-illness studies,[10] the productivity loss per case was calculated by multiplying an average duration of temporary disability by a wage rate for both investment and counterfactual scenarios. The duration represented the average days of lost work by the patient (or the patient’s parent for childhood malaria cases).
For both TB and malaria, the episode duration was not affected by treatment access, but for malaria, the episode duration depended on whether the case was severe or not. The episode duration for HIV cases was assumed to be the period of symptomatic untreated disease, which include untreated adult patients (>15 years old) with CD4 count below 200 in any one year. During this period, we assumed a 15% reduction in productivity.[11] Wage rate was derived from GDP per capita after subtracting country-specific natural resource rents obtained from the World Bank and a further downward adjustment to account for the disproportionate concentration of disease burden in groups of lower socioeconomic status. Productivity loss due to premature death (i.e. remaining lifetime earnings had the death not occured prematurely) was calculated by multiplying the average remaining working years of life at age of death by a wage rate. It was assumed that each HIV or TB death resulted in a loss of 15 working years, each malaria death in a person over or under 5 years old resulted in a loss of 25 or 30 working years, respectively, after accounting for a lag of 10 years before the working age period would begin.
Over 90% of the productivity-based ROI is due to averting productivity losses due to death. Our approach does not account for the potential societal-level impacts on other households not experiencing the disease-related death. It is possible, in settings where much labor is unskilled and unemployment levels are high, that when workers leave the workforce due to death or disease, they are replaced quickly by another – previously unemployed – person, so the net loss at the society level may be reduced. In addition, our analysis does not consider the future consumption (costs) associated with avoiding a premature disease-related death. Finally, we do not consider other macrolevel economic changes that may occur, such as a shift toward lower fertility and greater per-child investment as child survival increases, and the resulting increase in education levels and economic productivity.
The Global Fund commissioned a health decision scientist on the faculty of the department of Health Policy and Management at the Harvard T.H. Chan School of Public Health to conduct this study.
[1] For TB, the models are limited to TB among HIV-negative persons; outcomes for HIV-positive persons with TB are counted among the HIV statistics only.
[2] Institute for Health Metrics and Evaluation; https://www.healthdata.org/research-analysis/gbd
[3] https://www.tlomodel.org/
[4] U.S. Department of Transportation. Departmental Guidance on Valuation of a Statistical Life in Economic Analysis. 2022 [cited 2022 January 15]. https:// www.transportation.gov/office-policy/ transportation-policy/revised- departmental-guidance-on-valuation-of-astatistical-life-in-economic-analysis
[5] Robinson LA, Hammitt JK, O’Keefe LO. Valuing nonfatal health risk reductions in global benefit-cost analysis. Journal of Benefit-Cost Analysis 2019;10(Suppl 1):1-36.
[6] Pritchard C, Sculpher M. Productivity Costs: Principles and Practice in Economic Evaluation. London: Office of Health Economics; 2000.
[7] IMF. World Economic Outlook, April 2024 update. International Monetary Fund; 2024 https://www.imf.org/en/Publications/WEO/weo-database/2024/April
[8] Robinson LA, Hammitt JK, O’Keefe LO. Valuing nonfatal health risk reductions in global benefit-cost analysis. Journal of Benefit-Cost Analysis 2019;10(Suppl 1): 1-36.
[9] World Bank. World Development Indicators Databank. https://data.worldbank.org/ indicator/SP.DYN.LE00.IN. 2018 [cited 2018 Dec 4].
[10] Pritchard C, Sculpher M. Productivity Costs: Principles and Practice in Economic Evaluation. London: Office of Health Economics; 2000.
[11] Thomas R, Friebel R, Barker K, Mwenge L, Kanema S. Work and home productivity of people living with HIV in Zambia and South Africa: Evidence from the HPTN 071 (PopART) trial. 2019.
